Calculating Average Speeds and Volumes on Links
Requirements: Network, Events
Instead of looking at single vehicles, it is often helpful to look at links and see, if traffic on that link runs at near-free speed, or if the speed is reduced heavily due to congestion. This short tutorial will show how average link speeds and volumes can be calculated in Via, and how it can be visualized to gain a quick visual impression of the traffic state.
The volumes and speeds are extracted directly from the events, and not from already loaded vehicles. This allows to analyze very large scenarios, for which the vehicle trajectories could not be loaded due to the required memory to store them.
Data preparation
- Add the network and events file to Via.
- Create a Network Layer.

- Open the Network layer’s settings dialog.
- Select
Link Attributes, then click onAddand selectAvg. Speeds and Volumes.
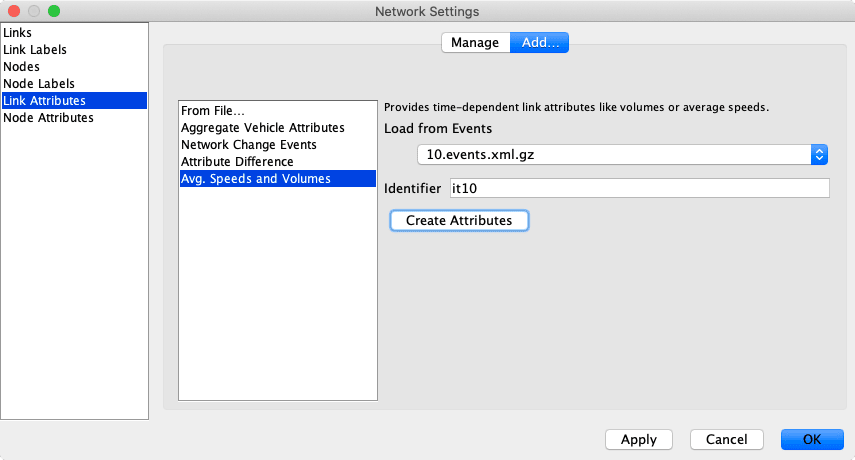
- Select the previously added events file, and optionally enter an Identifier. This identifier is useful if you load the average speeds and volumes from multiple runs to compare them.
- Click on
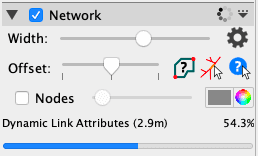
Create Attributes. A progress bar in the layer’s panel will show the progress of loading the necessary data.
- After the attribute has been fully loaded, select the attributes (
Volumes (absolute),Volumes (relative)) in the attributes list and adapt the settings if necessary. Especially if you visualize a population sample only, make sure to set the multiplier correctly (e.g. set it to10for a 10% sample, or to4for a 25% sample). The time resolution influences over which time window the average will be calculated.

Visualization
After the necessary attributes are created and properly configured, the network can be visualized making use of the new attributes.
- Open the Network layer’s settings dialog.
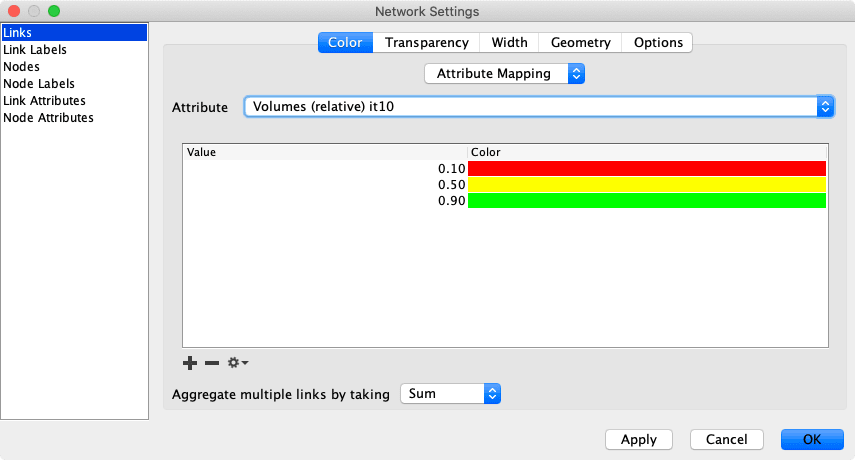
- Set the link color to type
Attribute Mappingand select theVolumes (relative)attribute.
- Set the link width to type
Attribute Mappingand select theVolumes (absolute)attribute. - Click on
OK
This should result in a visualization similar to the one shown below. Change the time of day and observe the different visualizations.

Visual Analysis
With the above settings, highly saturated links are shown in green. Note that these are not links with congestion, as in these cases the actual traffic volume might be much lower than the actual free flow capacity. With the additional width setting depending on the absolute volume, the visualization shows where large numbers of vehicles are moving in the network.
Alternatives
Detecting Congested Links
Instead of coloring the links with the average volume (either relative or absolute), it is also possible to color the links using the Avg. Speeds (relative) attribute. The relative average speed of a link is its average speed, relative to its freespeed, as defined in the link. In MATSim, vehicles typically travel very close to freeflow speed, unless there are more vehicles on a link than the flow capacity allows for. In such cases, the vehicles are held back in MATSim, resulting in a longer travel time on that link and thus a lower speed.
By coloring the links by the relative average speeds, those links with a low relative speed can be highlighted, representing the links that are congested. This can be combined with setting the links’ width based on the links’ fixed flow capacities. In this case, traffic jams on major roads will be more visible than traffic jams on minor roads.