Public Transport
The public transport plugin provides functionality for working with transit related data in MATSim. Most of the functionality is for working with MATSim’s transit schedule data and the outcome from a simulation including public transport.
Table of contents
- Transit Schedule Layer
- Transit Vehicles at Stop Locations
 Transit Stop Query
- Transit Line Query
 Transit Router
- Transit Lines on Link
 Transit Route Analysis
 - Passengers at Stop
Transit Schedule Layer
Displays transit stop facilities and transit lines.
Requires a loaded transit schedule file. Optionally transit vehicles and events for simulation analysis.
This layer displays all stop facility locations and supports many of the transit related queries with schedule data. If the optional Events and Transit Vehicles are provided upon creation of the layer, additional queries are available to asses simulated performance measures.
![]()
When this layer is loaded, it provides two ID Sets, one containing all transit vehicle ids, the other containing all transit driver ids. These ID Sets can be used to differentiate the transit vehicles from other vehicles, or to filter out transit drivers from the rest of the agents.
Transit Vehicles at Stop Locations
Displays transit vehicles at stop locations.
Requires a loaded transit schedule file and events.
Vehicles’ positions are interpolated along links according to their link-enter and link-leave events. If a transit vehicle serves a stop, it’s time on a link increases, resulting in a slower interpolation from start to end of a link. This layer loads additional data from MATSim events to accurately show vehicle positions along links, respecting the time vehicles are stationed at stops, and also shows the vehicles stationary at the stop locations.
Transit Stop Query
This query allows to identify stop facilities by clicking on them, or by searching for them given their id or name. If the layer was loaded with events, the query also offers statistics about the number of persons waiting at a stop location over the time of day in a chart.
Transit Line Query
The transit line query allows to analyze and visualize the routes of transit lines. When the transit stop query is active, a search field for transit lines is provided in the query section, allowing to search for lines. Alternatively, transit lines and routes serving a stop are listed when querying a transit stop, or a list of transit lines running on a link can be queried, from where the transit line query can be issued.
From the transit line query, each transit routes can be analyzed in more detail, see below.
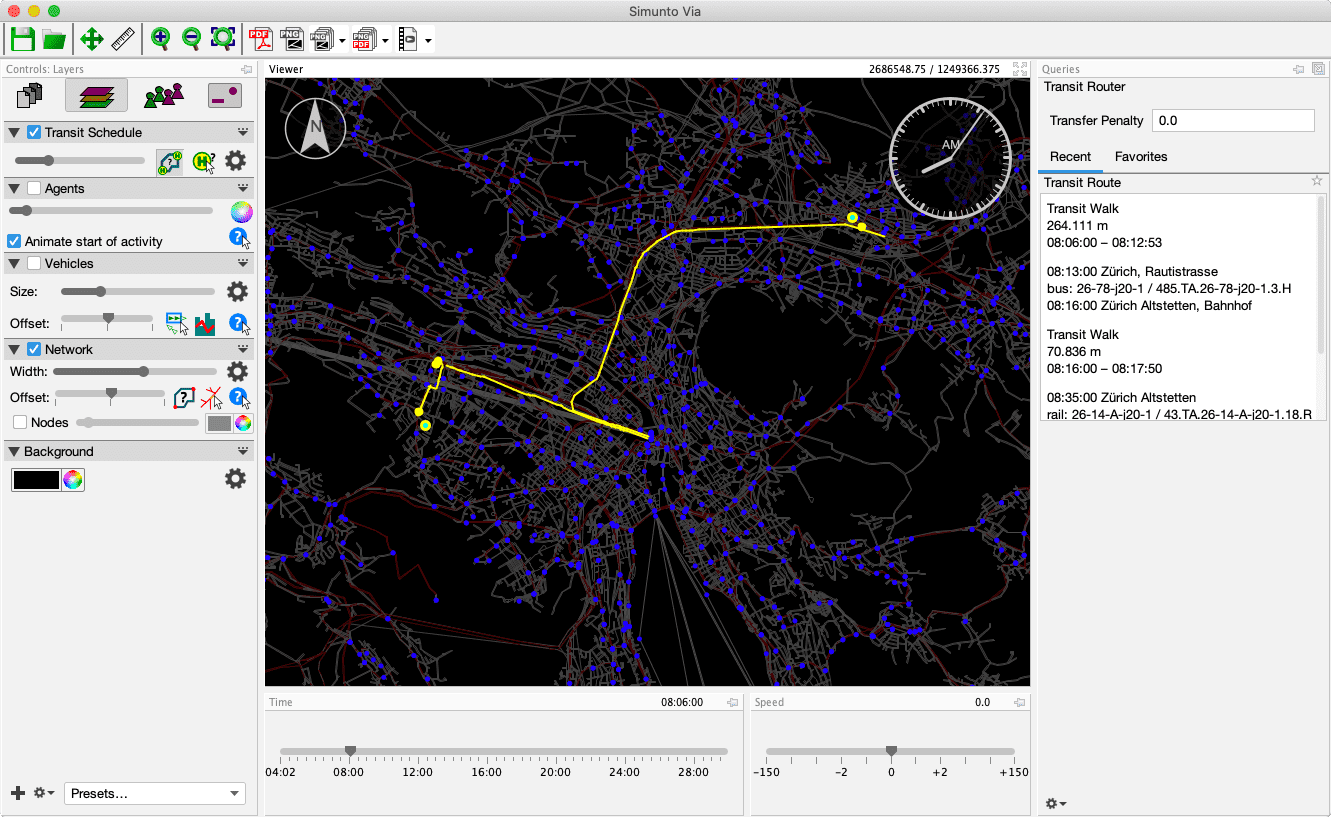
Transit Router
With the transit router query it is possible to calculate transit routes connecting different locations at different times. After enabling the query by clicking on its icon in the layer’s panel, click and hold the mouse button at the start location, then drag to the end location and release the moues button. Via will then calculate the pt route a transit passenger would take at the current time of day (the first time Via needs to initialize internal data structure, which might take some time).
Transit Lines on Link
When the public transport plugin is available, and a link in the network is clicked on with the network query tool, an additional option “Transit Lines on Link” is presented. When selecting this option, all transit lines will be listed that run along the selected link, allowing the corresponding lines and routes to be analyzed in more detail.
Transit Route Analysis
The transit route analyses are available for each transit route. Some analyses also require the Vehicles layer to be loaded. Each analysis can either be applied to exactly one departure of the selected route, of for all departures within a specific time window. If not stated otherwise, the departure time at the first stop of the route determines if a departure falls within a time window or not.
Passengers Entering/Leaving
This analysis shows the number of passengers entering or leaving at each stop. It also shows the number of passengers that are within a transit vehicle when it departs at a stop. If multiple departures are selected, values are accumulated.
![]()
Vehicle Load, Aggregated Vehicle Load
The Vehicle Load analysis shows for each departure the number of passengers in a transit vehicle when it departs at a stop. If multiple departures are selected, values are not aggregated, but shown for each single departure.
In contrast, the Aggregated Vehicle Load analysis extracts aggregated statistical values from multiple departures.
Route Grid
The Route Grid analysis shows for each served transit stop and hour the number of passengers entering or leaving a transit vehicle of the selected transit line.
Route Flows
This analysis shows the flows of passengers along the transit route: It shows which parts of the route passengers travel. This analysis gives an easy overview if demand is about equally distributed along a route, if there are some hubs along the route (e.g. for feeder lines, where most people enter or leave at one specific stop), or even if a long transit route could be split into two parts without having too many people needing to switch from one line to another.asdf
![]()
Passengers at Stop
When a single stop facility is selected, the number of passengers boarding or alighting per service or per time bin can be shown with the Passengers at Stop query. By default, the query shows the number of passengers alighting or boarding for every service departing or arriving at the stop. For large stations, this might include too many rows. In such cases, it is helpful to aggregate the data into time bins, e.g. 15, 30 or 60 minutes.
![]()