Network Queries and Analyses
Table of contents
 Identify Network Element
- Link Volumes
 Select Link Analysis
- Intersection Flows
 Calculate fastest Route
All queries and analyses presented in this section require a Network layer.
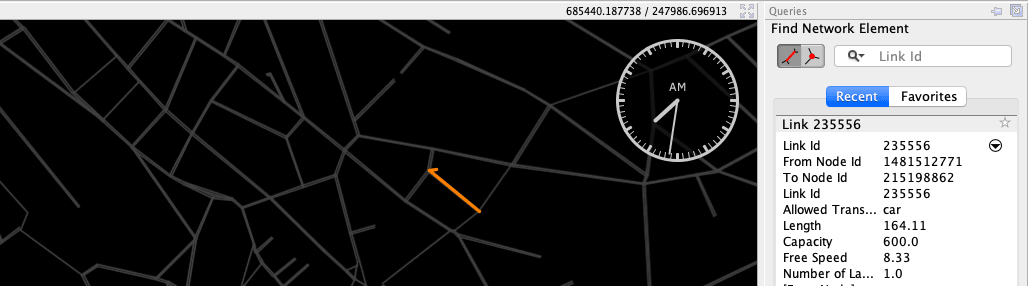
Identify Network Element
This query can be used to identify links or nodes in a network. It supports a direct search as well as a reverse search approach: Either you want to know where a specific link or node is located, then you enter the object’s id into the search field. Or you want to know which link or node it is you see on the viewing area, then you can just click on the link or node in the viewer. To activate the query, click on the query icon () provided in the network layer settings.
Once a link or node is selected, a number of additional queries are available upon right-clicking into the visualization area. Examples of such further queries are Link Volumes and Intersection Flows as presented in the next sections.
Spatial range queries are also possible: Click and drag in the visualization area to select multiple links and nodes. The details of all of the selected elements will then be shown in the query panel.
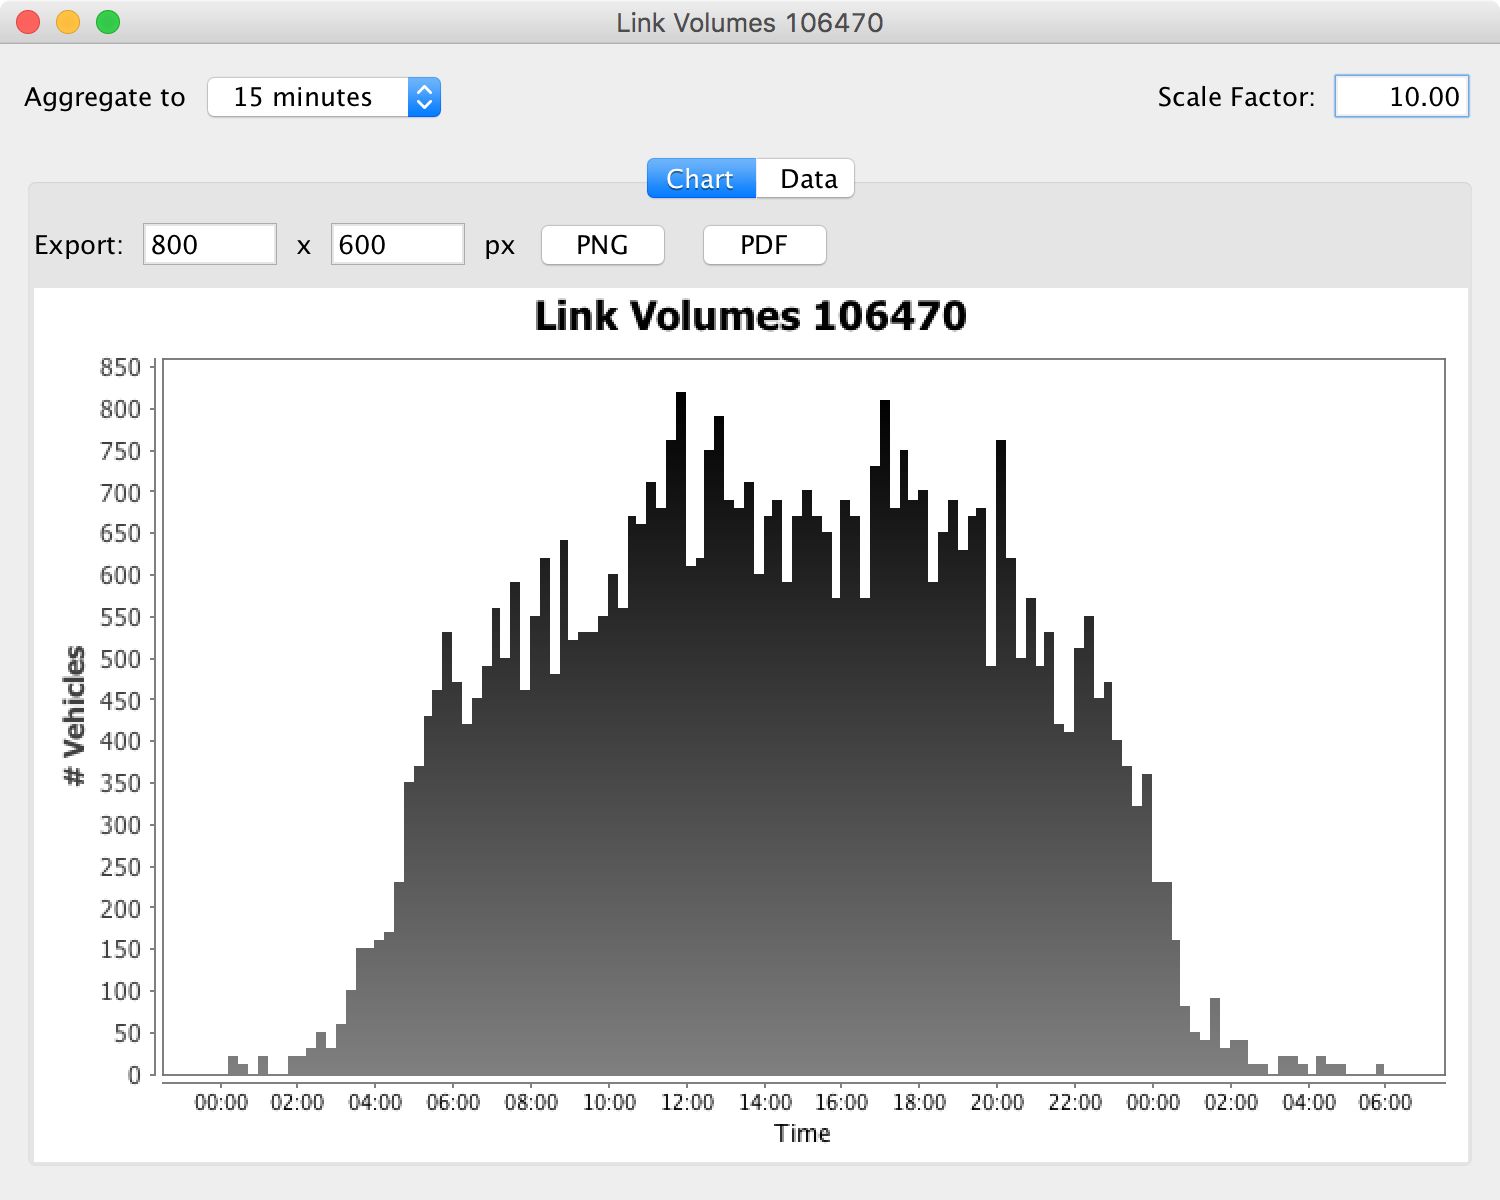
Link Volumes
The Link Volumes query shows the detailed link volumes of the selected link. It allows to aggregate the volumes into different time bins and settings a scaling factor to represent correct volumes if only a population sample was simulated.
To query the link volumes, select a link first, then right-click in the visualization area and select ”Link Volumes”.
Select Link Analysis
Selecting one link for this query, it analyzes which vehicles are currently located on that link, and then highlights all links where those vehicles will travel along during their current trip or even during the whole day. Instead of all vehicles currently located on the link, the analysis period can be extended to incude all vehicles on that link in the current quarter, half or full hour or even on the whole day. The query result is dynamic: If the time changes and vehicles enter or leave the selected link, the highlighted links will change accordingly depending on the actual vehicles being on the link.
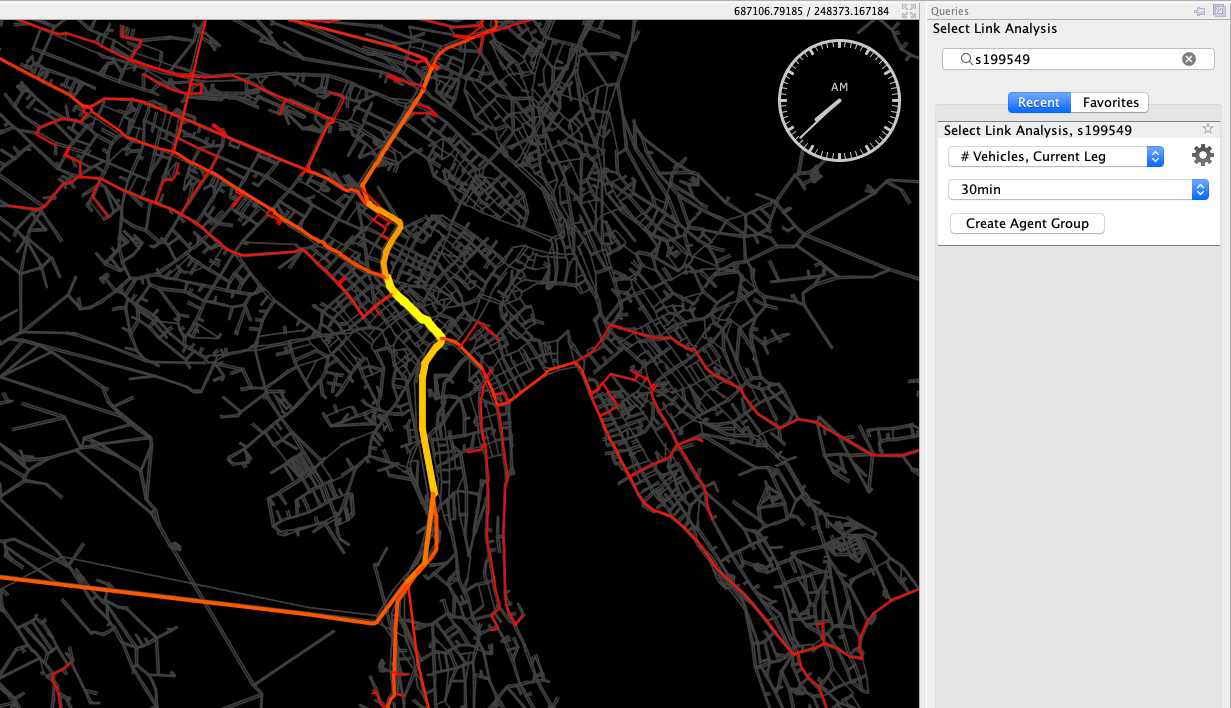
To create a Select Link Analysis, select the corresponding query tool in the network layer’s settings panel and click a link. Alternatively, you can first select a link with the regular network query, and then right-click and select “Select Link Analysis”.
Intersection Flows
The Intersection Flows query shows the number of vehicles that cross the selected node, showing the different routes the vehicles take.
To show the intersection flows, first select a node, and then right-click in the visualization area and select ”Intersection Flows” from the popup-menu. The query supports filtering by time, such that only the flows of a specific time frame or rush hour can be analyzed. When moving the mouse pointer over one of the flows, the volumes of only that flow will be shown on the histogram.
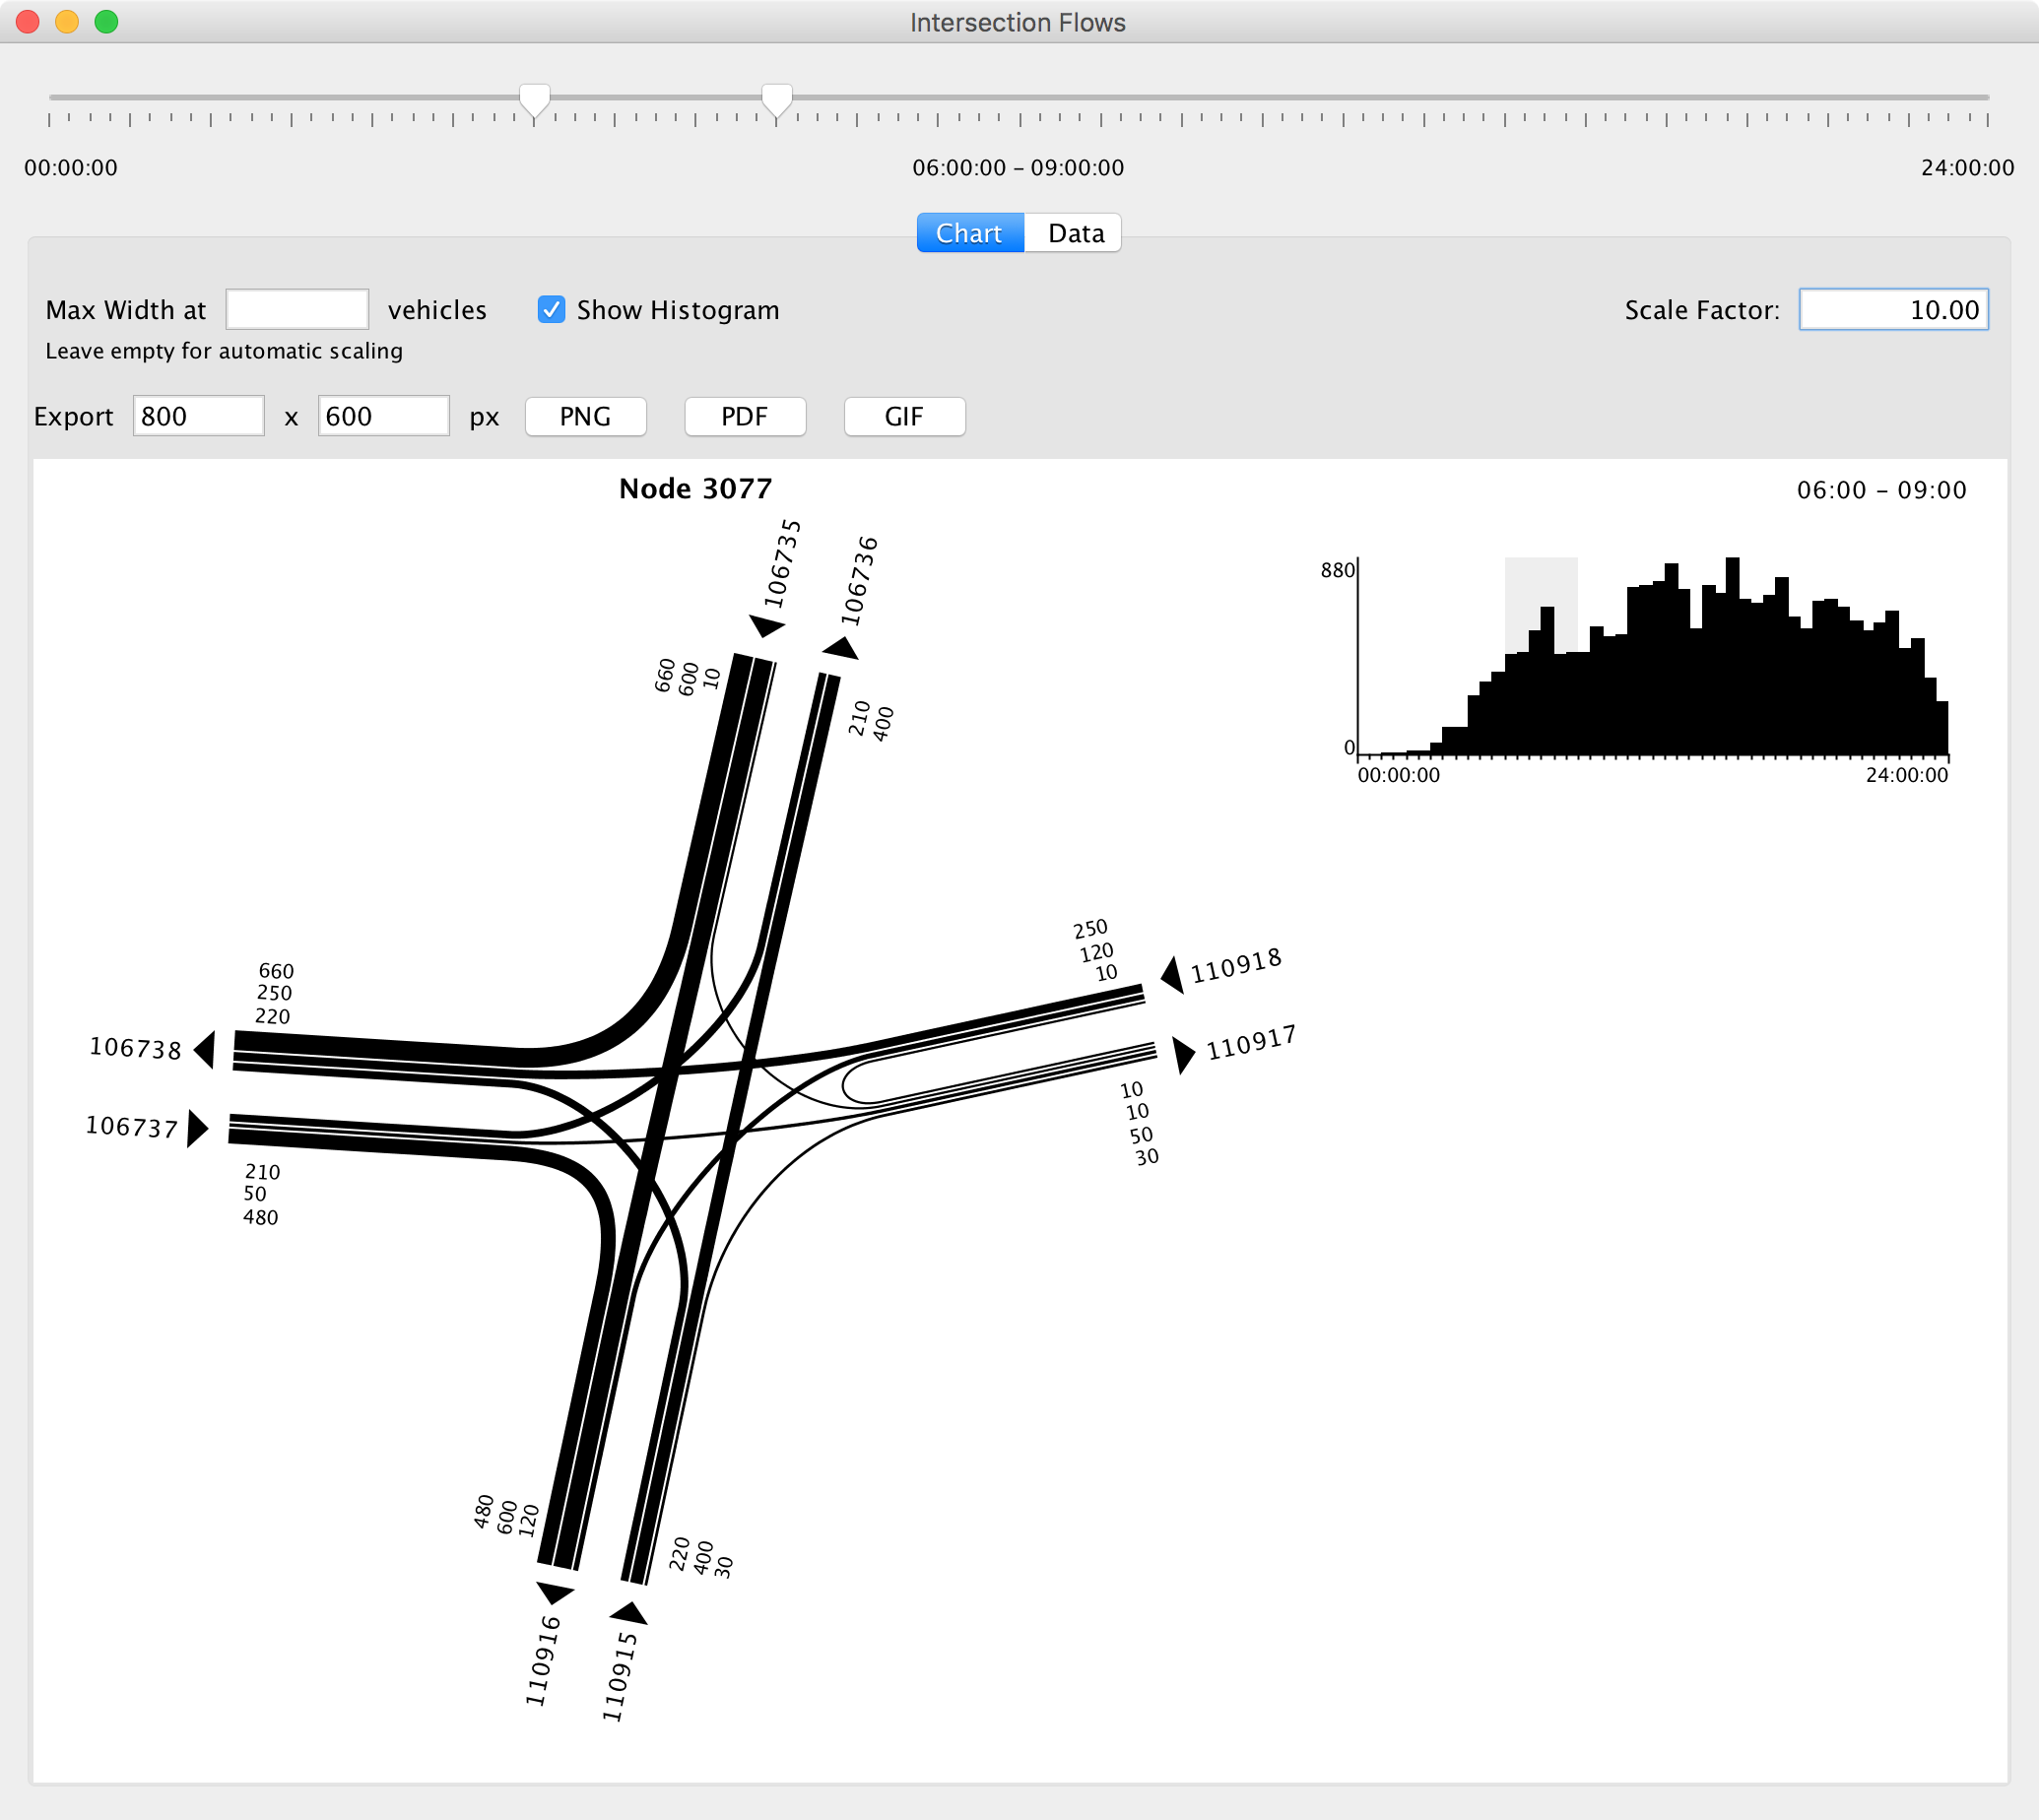
The lines’ thickness is typically scaled such that the highest shown volume has a fixed width. This may lead to interpretation difficulties when comparing two times frames, one with a large number of vehicles crossing the node and one with a small number of vehicles crossing the node, as both might look similar. To overcome this problem, it is possible to specify a custom value as largest volume to be used for determining the scale factor of the lines.
The chart can be exported into the usual formats (PNG, PDF), but also as animated GIF. In this case, a GIF image showing the flows hour by hour is created.
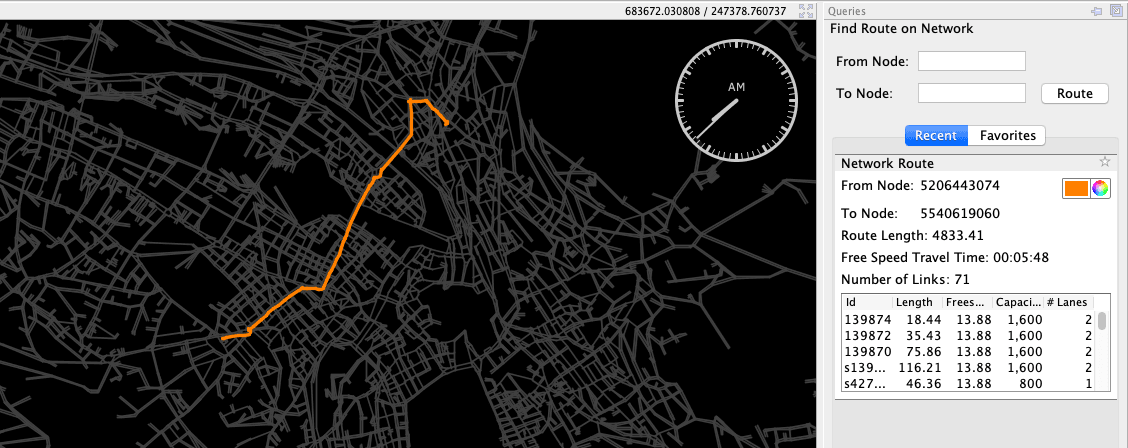
Calculate fastest Route
With the routing tool activated, click and drag from the start location to the destination in the network. Via will then calculate the fastest route based on freespeed travel times in the network and show the resulting route as well as some metrics like total distance and travel time.