First Visualization
This section gives a brief introduction on how to visualize MATSim data. See the following chapters for more details and a more extensive description of available functionality.
Table of contents
Required Data
Via directly supports loading most of the common MATSim data formats, such as networks, events, plans, facilities, and transit schedules. The sample data contains two scenarios, the very basic transit-tutorial and a larger zurich-pseudo. You can use either of them for the following steps.
Visualization Principles
Visualizations in Via typically consist of two steps:
- Load the necessary data
- Visualize the data as a “layer”
This two-step process allows for re-using data (e.g. a network) for multiple layers (e.g. showing the network itself and visualizing vehicles) without the need to load the data multiple times.
To manage the loaded data and the visualization layers, Via provides corresponding panels to the left of the visualization area:
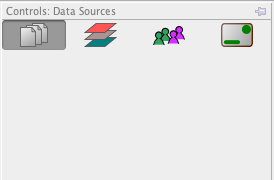
Network
Start Via, and after the main window appears, choose File > Add Data.... Navigate to your scenario and select the file network.xml. This adds the network as a data source, and it will appear in the list of available data sources.
Hint: You can also just drag and drop files to the Data-Sources or Layers list to add them.
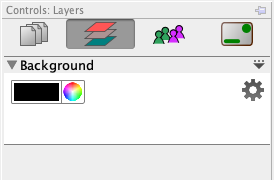
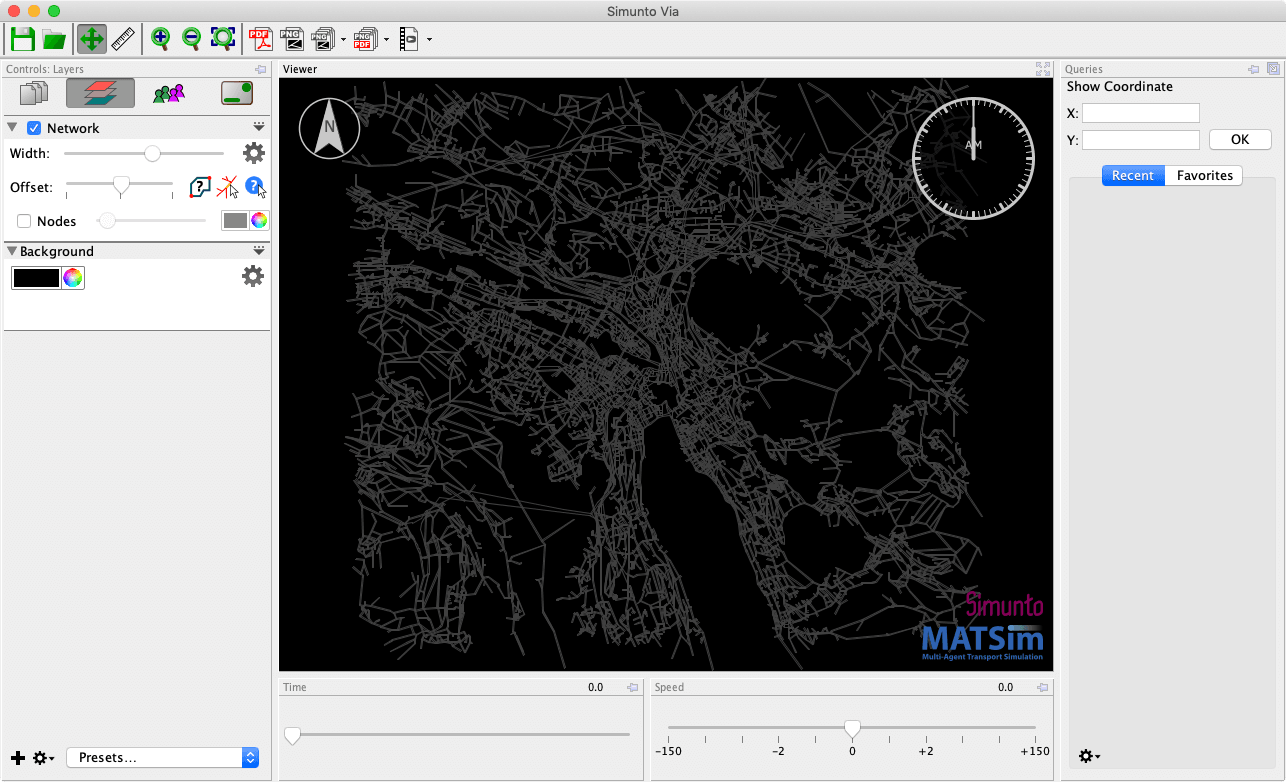
Next, choose File > Add Layer... and click on Network. The just previously loaded file is suggested to be used, which is okay. Click on Add to add the network layer. The network should be shown in the visualization area and the network layer be listed next to it.
![]()
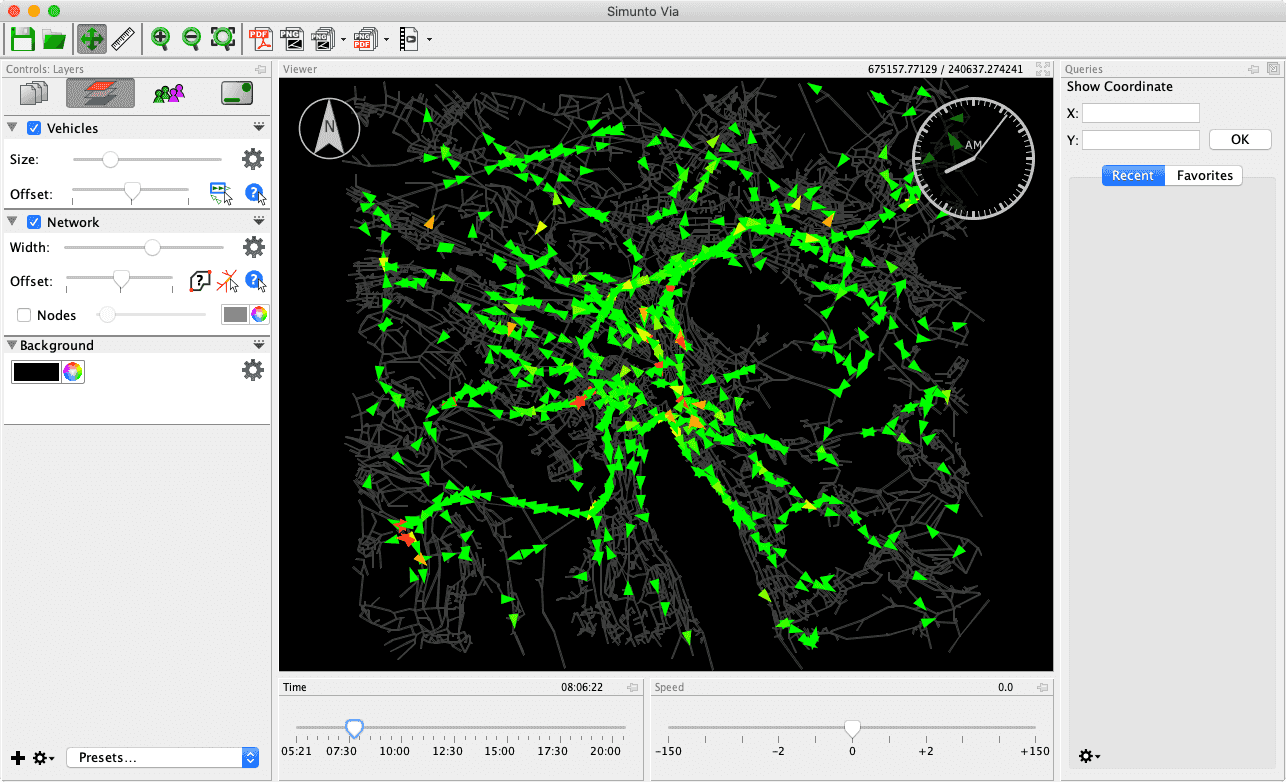
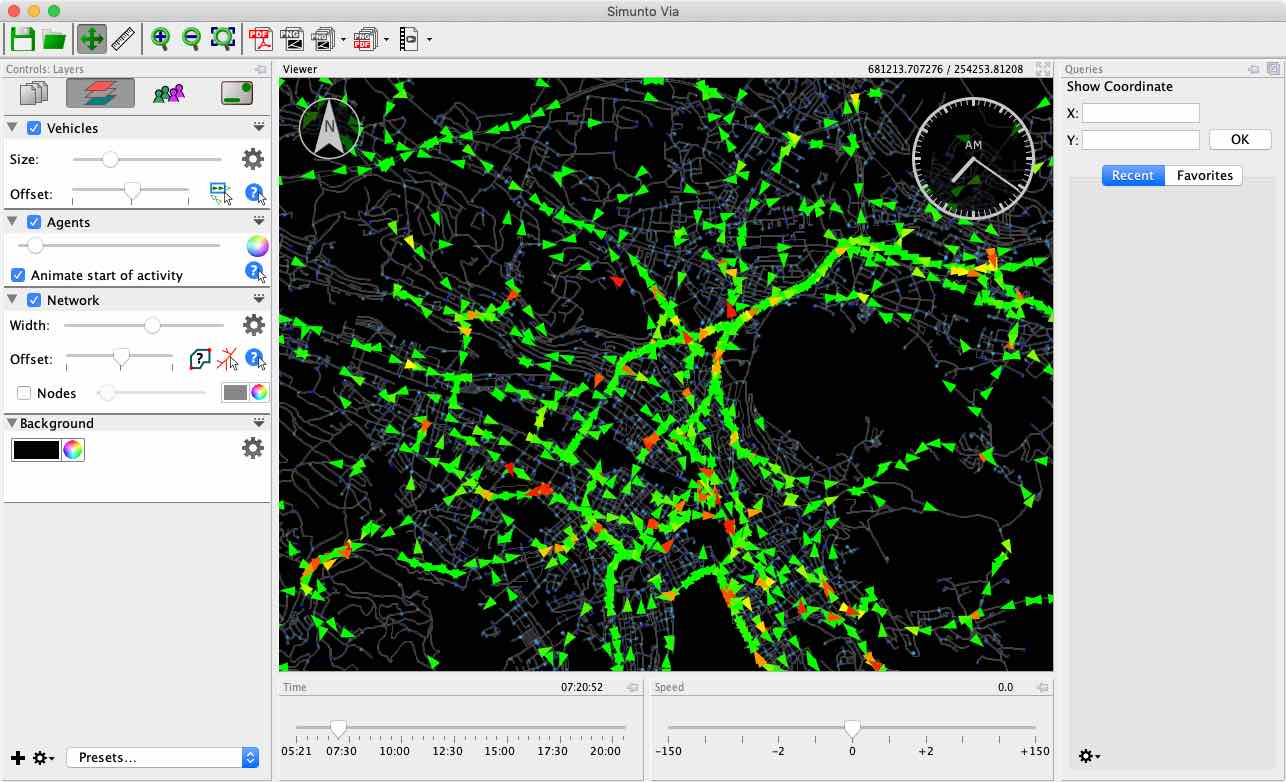
Vehicles
To visualize vehicles, choose File > Add Data... and select the file 10.events.xml.gz (or just drag and drop the file onto the layers list). Then, add a Vehicles Layer (File > Add Layer..., select Agents > Vehicles, click Add). The vehicles layer will also be listed on the side of the visualization area.
As event files can be rather large, they are not automatically parsed. Instead, layers that depend on events, show a button Load Data which must be clicked manually in order to parse the data from the events. Click this button to start the parsing of the events. Once this process is finished, a timeline appears beneath the visualization area. Move the slider to some point in time (e.g. to 8 o’clock) or move the speed slider next to it to animate the shown time. Soon you should see green triangles, representing vehicles, moving around the network.
Play around with the Size and Offset sliders in the layers’ settings area, and see which effect they have on the visualization.
![]()