Agent Queries and Analyses
Table of contents
All queries and analyses presented in this section require a Vehicles layer.
 Identify Vehicle
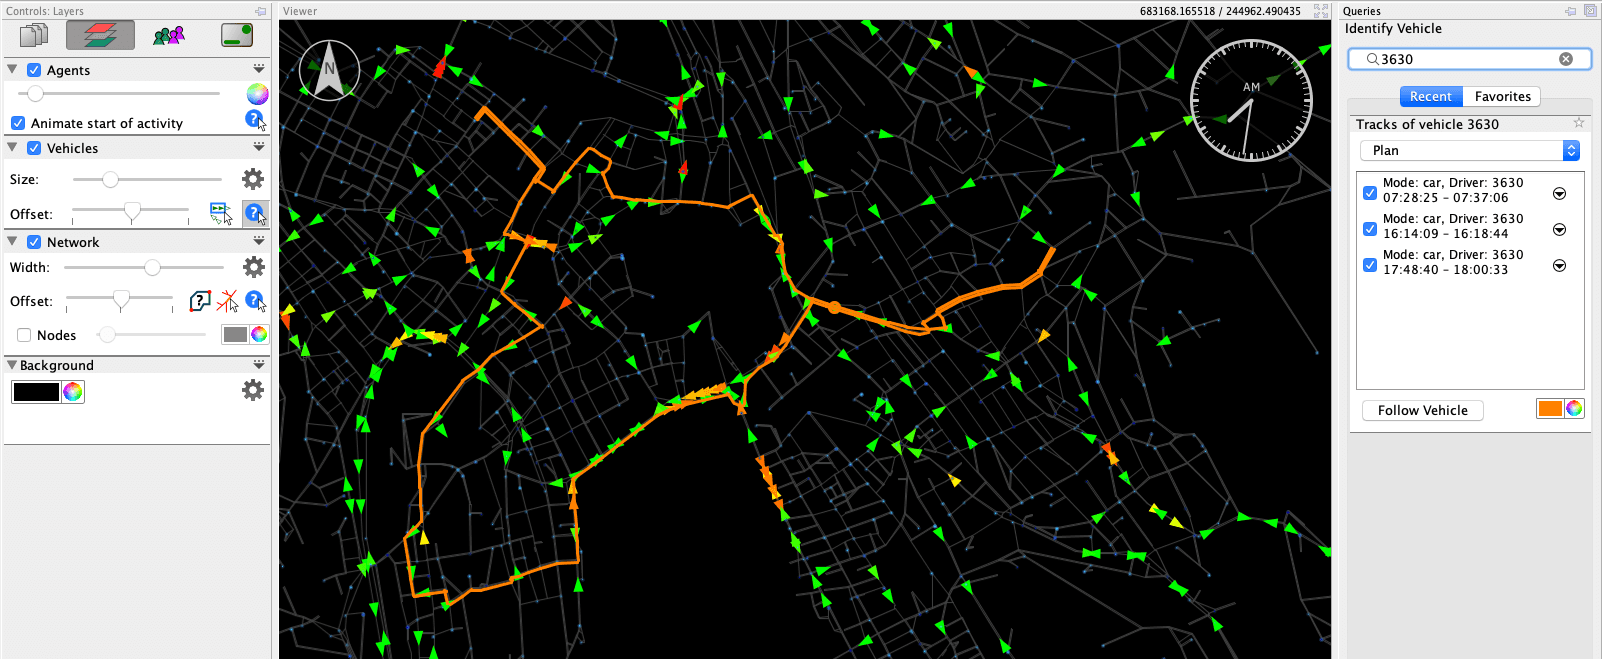
The query can be activated by clicking on the query-button () in the Vehicles layer’s settings panel. If this query is selected, one can either click on a vehicle or enter the vehicle’s id and press Enter to show an agents day play. The vehicles’s trips are highlighted in the visualization area and listed as a query result.
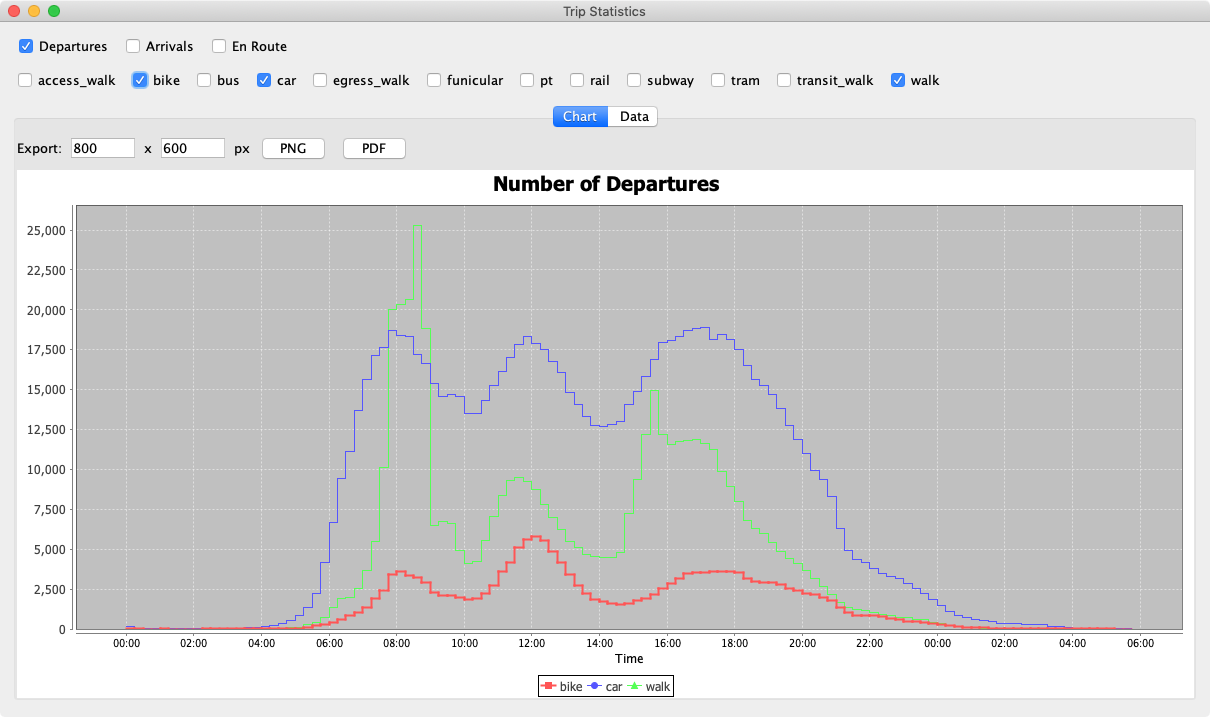
Leg Statistics
This analysis provides an overview of how many legs are being performed by which transport modes. It is available in the layer’s action menu.
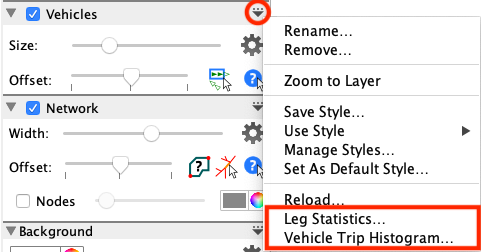
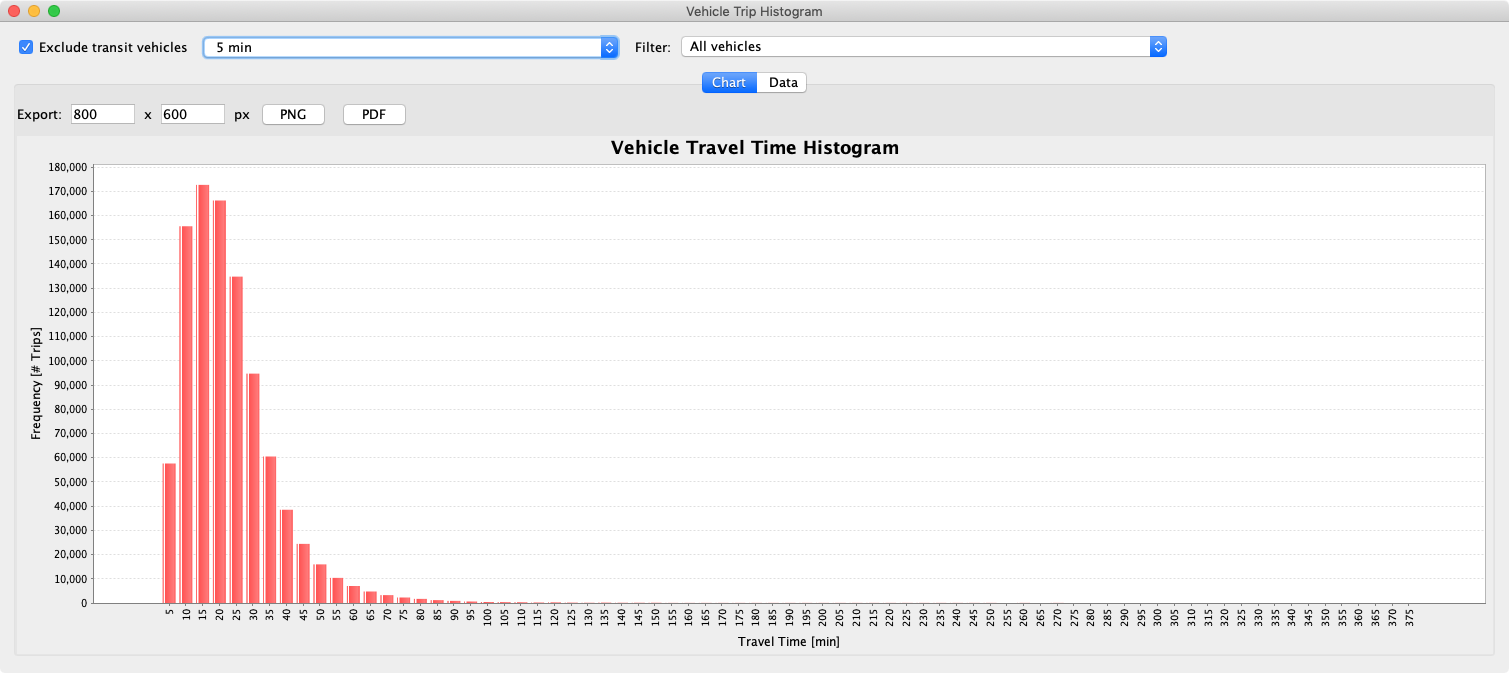
Vehicle Travel Time Histogram
This analysis provides a histogram, showing the distribution of trips with a certain travel time. It is available in the layer’s action menu.
 Vehicle Statistics
The vehicle statistics contains a number of analyses related to vehicle fleets:
Vehicles En-Route
This analysis shows the number of vehicles being on route depending on the time of day.
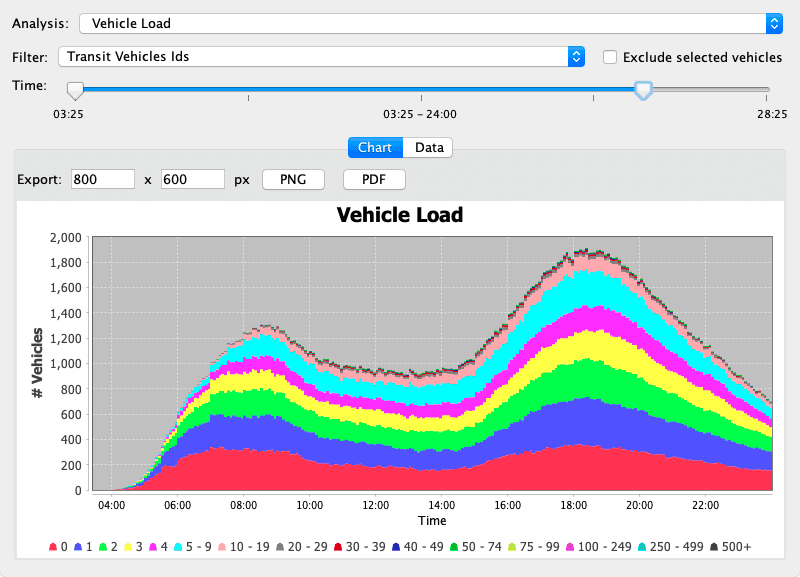
Vehicle Load
This analysis requires that the “Vehicle occupancy” attribute is loaded. It can be added by opening the Vehicles Layer’s settings panel, clicking on Attributes, then on Add and then add the Vehicle occupancy attribute.
When the attribute is available, the analysis will show a distribution of the number of passengers in vehicles en-route. This is especially useful for vehicle fleets that provide public transportation services, like transit, taxi, or DRT vehicles. In order to focus on a specific vehicle fleet, the analysis supports filtering the vehicles by ID Sets.