Car Counts
The Car Counts plugin provides functionality to compare the simulation data against real-world traffic counts.
Table of contents
Car Counts Layer
Displays comparisons between simulated and real-world traffic counts.
Requires a loaded traffic counts file to visualize counting station locations. For comparisons to simulated traffic counts, an events file is required as well.
This layer allows the visualization of traffic counting station locations and perform extensive comparisons of real-world traffic counts to simulated traffic volumes. Once the layer is added, one can see the locations of the counting stations (white circles) and the links that are assigned to the counting stations. The links can show how well the simulated counts match the real-world counts with different colors. As an alternative, symbols (a “plus” or a “minus”, depending on amount of simulated traffic compared to the counted traffic) can be displayed in different colors. To simplify the identification which link is mapped to which counting station, connectors can be displayed as well.
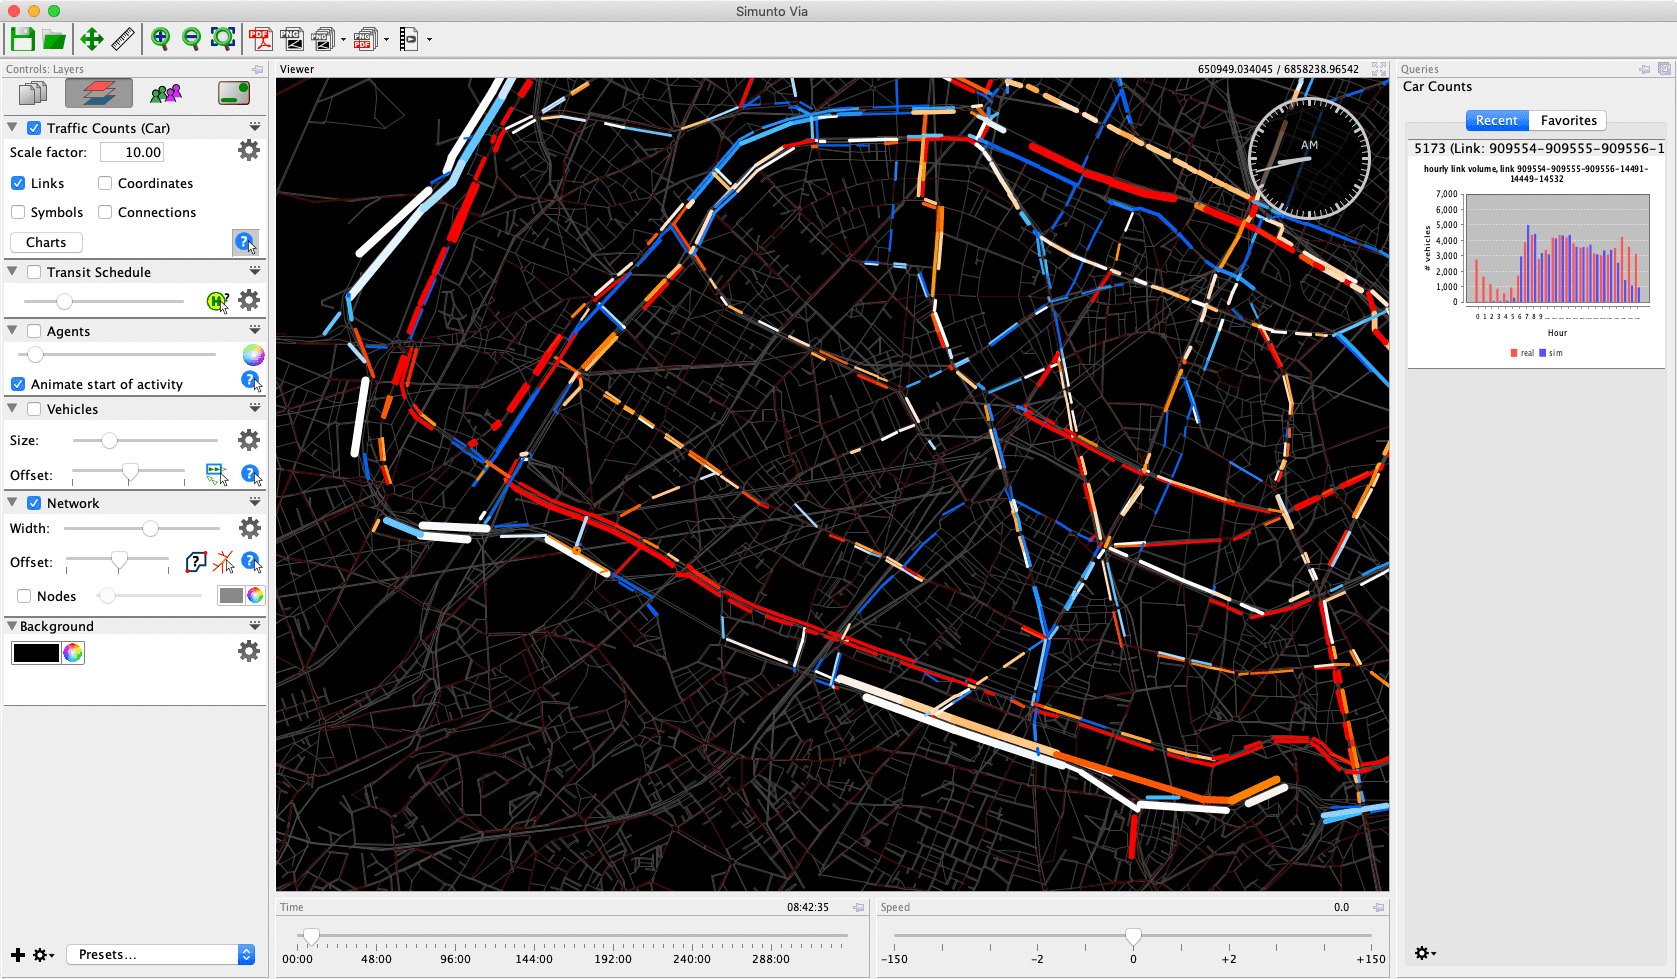
If the events data is from a sampled simulation run only (e.g. a 25% sample run), the simulated counts, extracted from the events file, can be scaled by a corresponding factor (in this case: 4.0) in order to make the comparison between simulated counts and real counts meaningful.
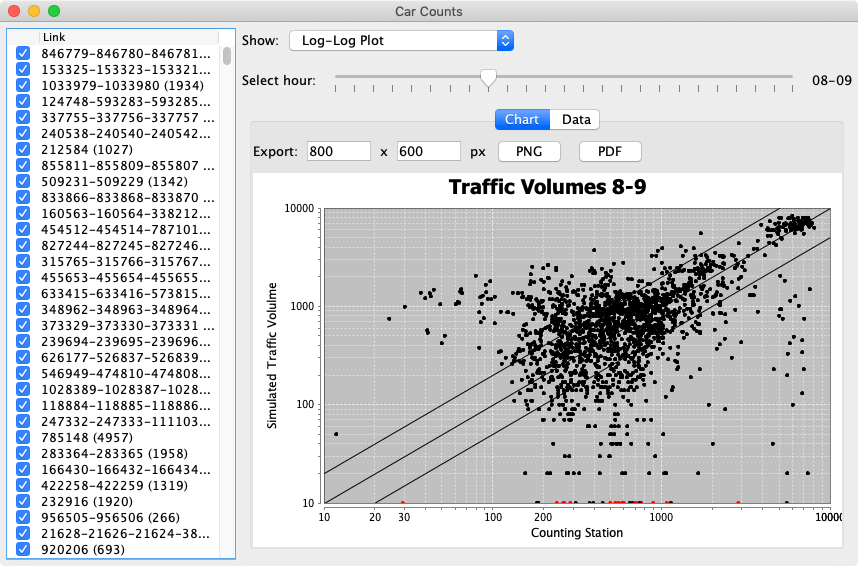
In addition to the visualization in the viewing area, the counts data can also be analyzed using a number of charts and tables, by clicking on the “Charts” button. In the window that opens, comparisons for all (selected) counting stations or just for single counting stations can be done, typically either per hour for for the whole day. If counting stations are outside the study area, or are known to contain outdated or wrong data, they can be excluded from the analyses by unticking them in the list.