Analyze the Activities of Passengers of a Single Transit Line
Requirements: Network, Events, Transit Schedule, Transit Vehicles
Data preparation
- Add the network file, events file, transitSchedule and transitVehicles files to Via.
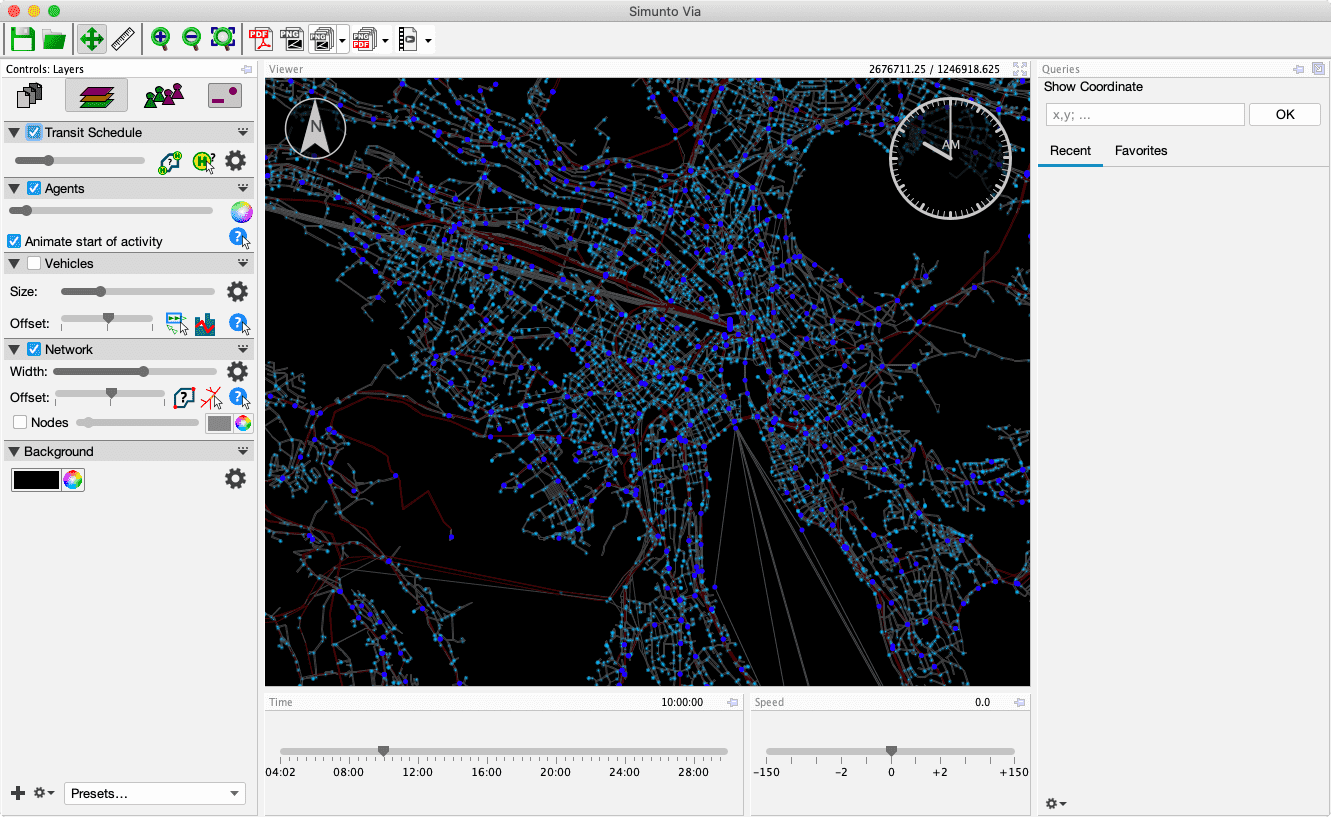
- Create the following layers:
- Network
- Agents (from Events)
- Transit Schedule
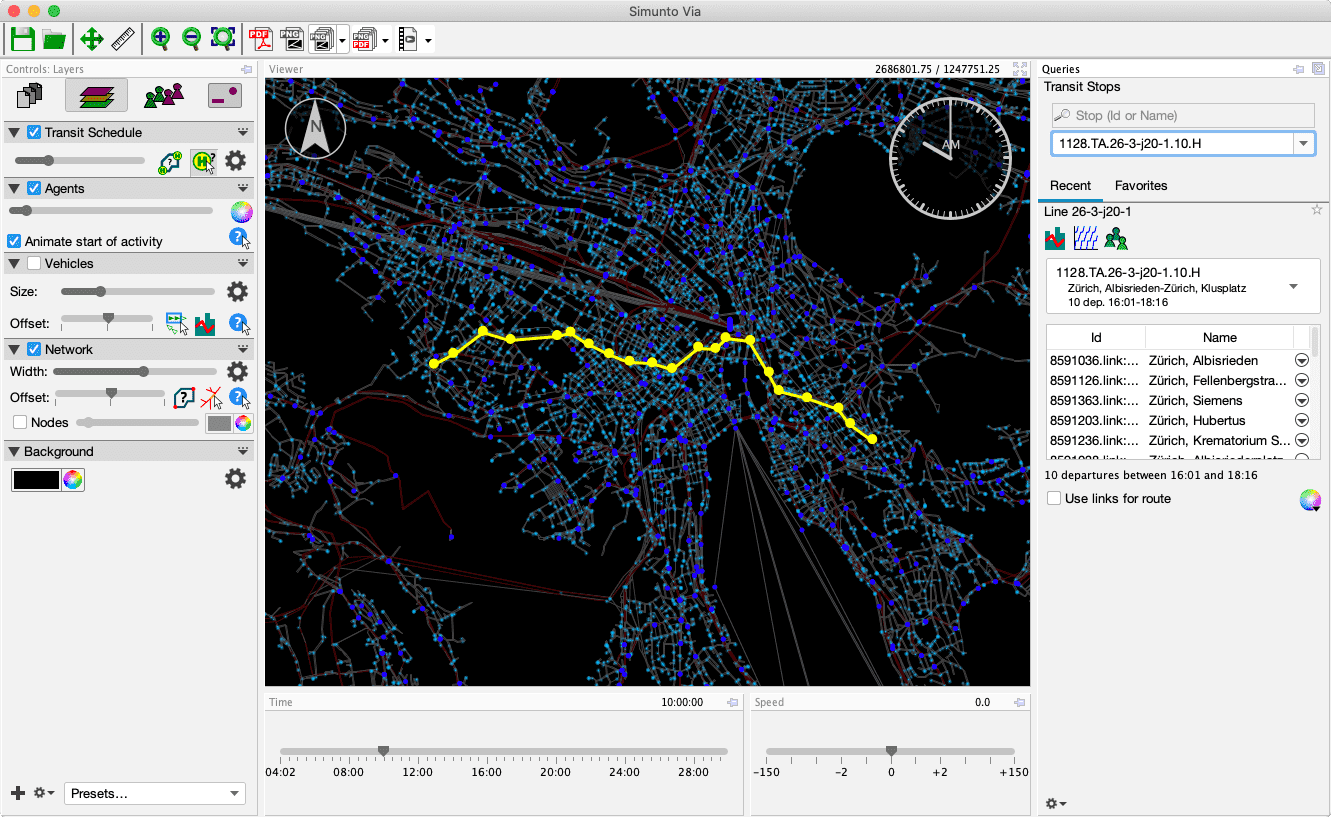
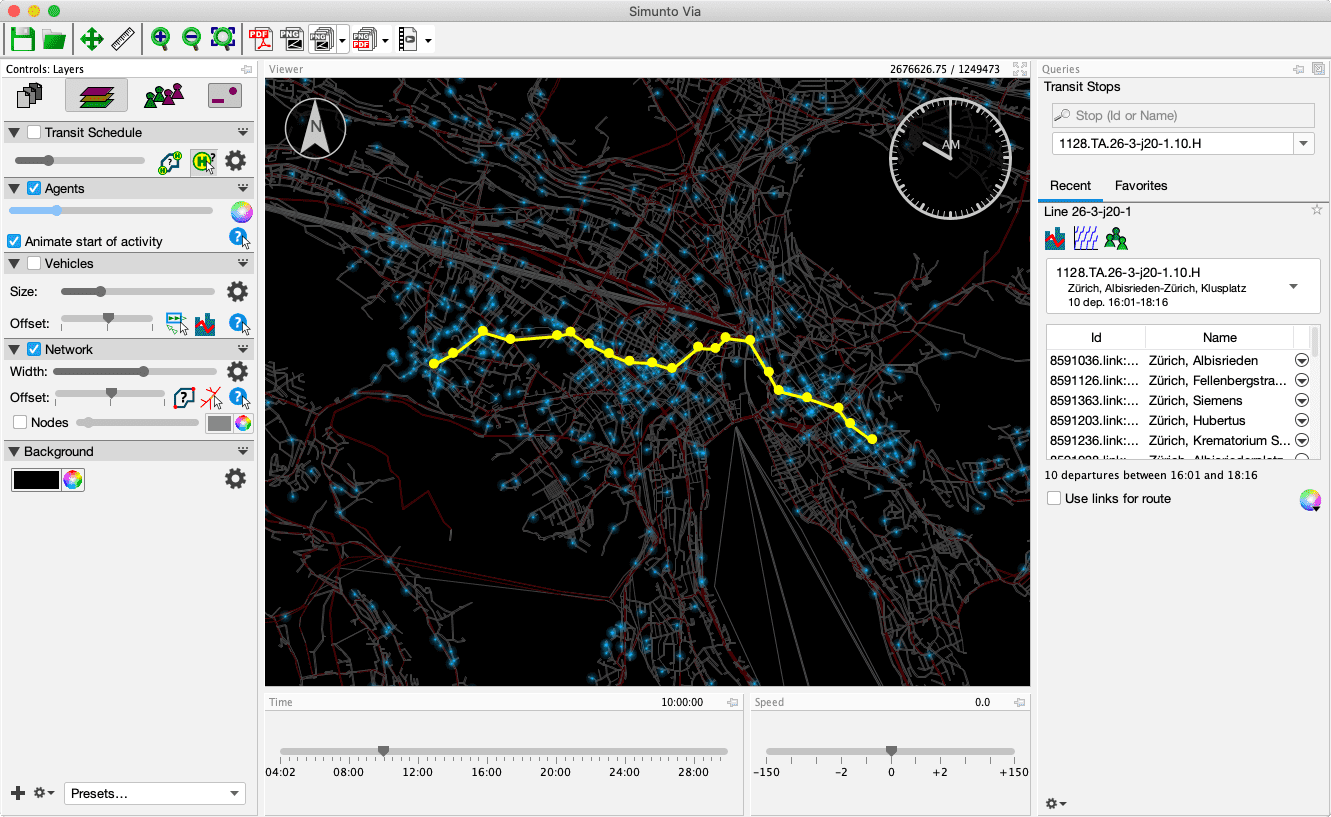
- Select a transit line of interest, by activating the Transit Schedule query and either clicking on a stop and then select one of the lines, or by directly searching for a transit line.
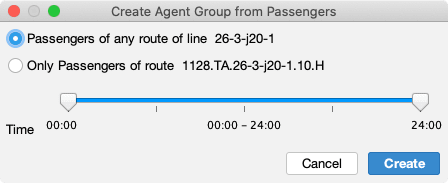
- Click on the “Create Agent Group” button to create an ID Set containing all the passengers IDs.
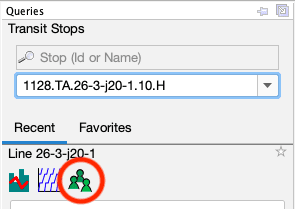
- Select the appropriate options, click
Createand then enter a name for the new agent group.
Visualization
- Open the Agents’ layer settings dialog and add a new group by clicking on the plus-icon. Enter a name for this visualization group (“pax” in the screenshot below) and select the previously generated agent group from the popup menu (“paxLine26” in the screenshot below). Then disable the Default group by unchecking the checkbox in front of it, so only the “pax”-group will be visualized.
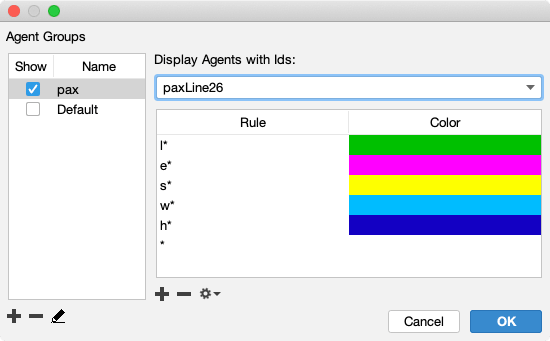
- After clicking on
OK, you should only see activities from agents that, at some time during their day, use the selected transit line. Change the time and observe the changing activity locations.
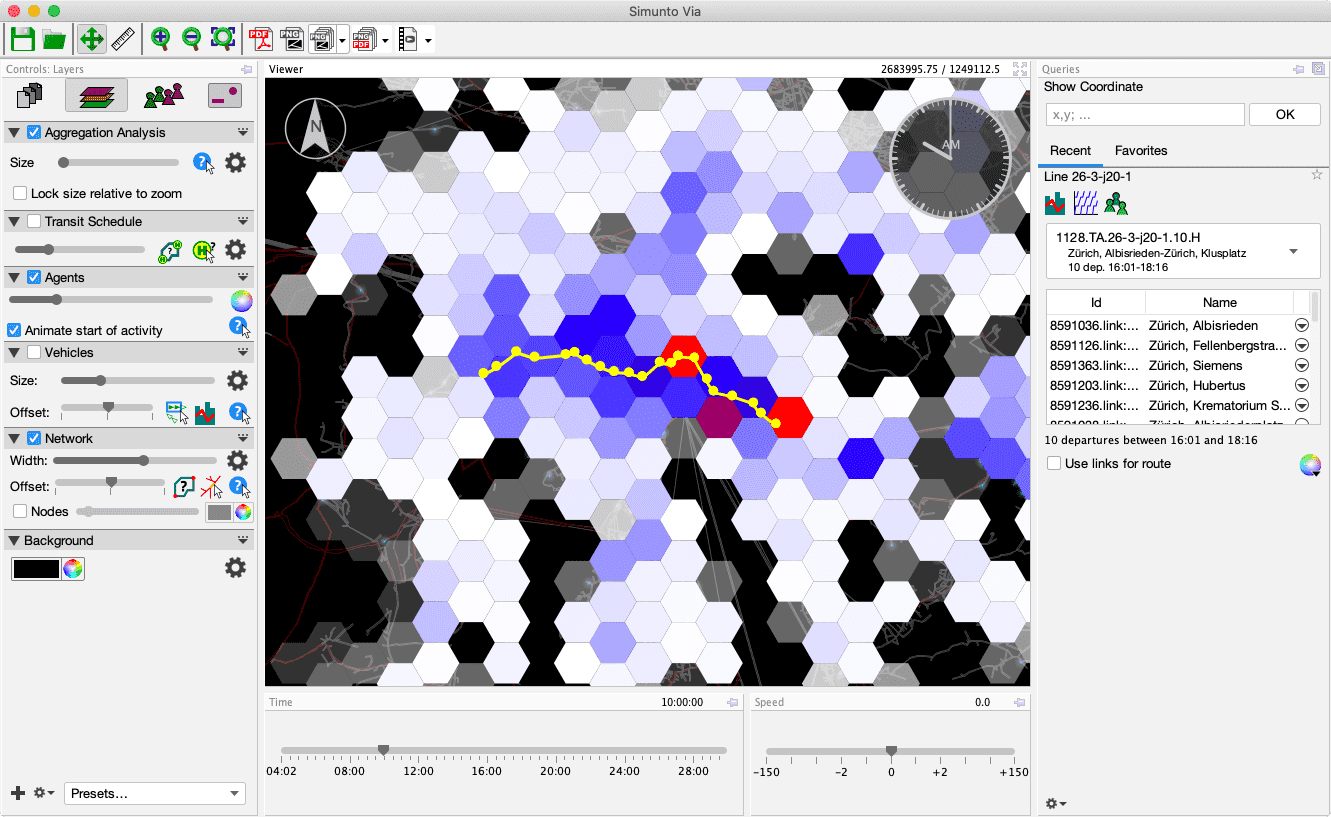
Alternative using the Aggregation Plugin
The above visualization only shows the current activities, depending on the chosen time of day. But sometimes it is of interest to know about all activity locations. This is where the Aggregator plugin is helpful.
- Add an Aggregation Layer and open its settings dialog.
- Create a new aggregation attribute. Give it a name, select
Activitiesas data source, and add a new filter forPerson Id,in Agent Group, and select the previously created ID Set.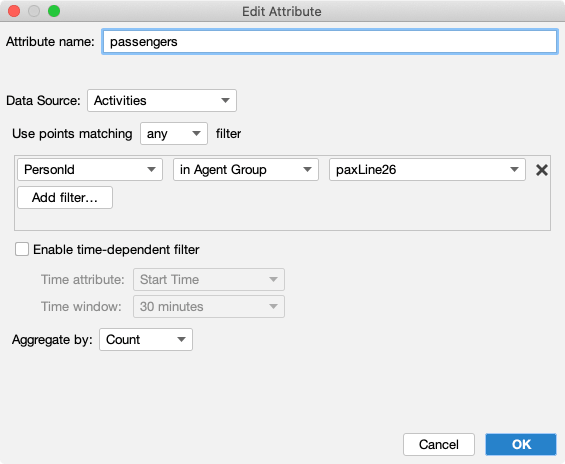
- Click
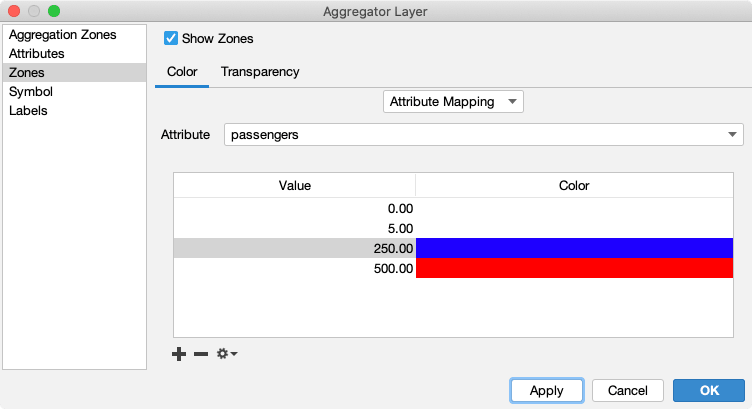
OKfor the attribute to be calculated. - Open the settings dialog again after the attribute has been calculated.
- Select the new attribute to color the zones, providing a suitable numeric range.
- Click
OKto see a heatmap of all activities of the passengers of the selected line.