Stuck Agents Analysis
Table of contents
Via is great at visualizing and analyzing the agents performing their activities and legs. But agents getting stuck in the simulation during their day are hard to analyze, as they just disappear at some point in time.
The Stuck Agent analysis helps to figure out why agents are getting stuck by providing an analysis on when and where agents are getting stuck. This allows then to have a closer look at identified links or stops to see why agents are getting stuck at the respective places.
Running the Stuck Agents analysis
Make sure you have added at least one events-file to Via. For best results, also add a Network and Transit Schedule as Layers to Via.
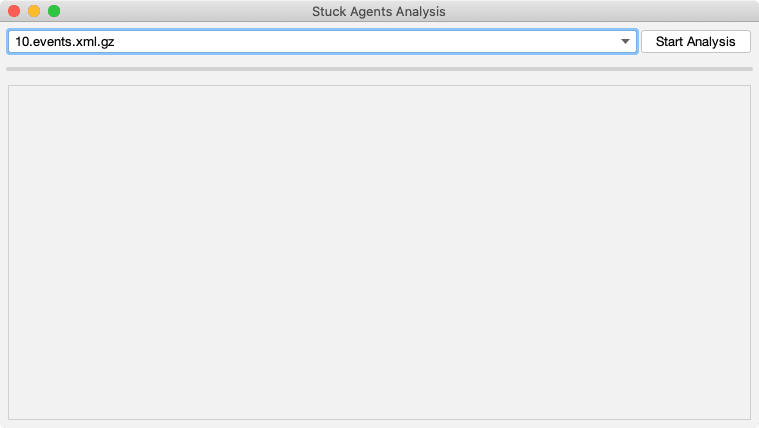
Select Stuck Agents Analysis… from the Tools menu. A new window will open, where you can select the events file to analyze. Then click on Start Analysis.
Via will now parse the events, trying to figure out which agents cannot finish their plan and preparing a report on its findings.
Working with the results
Once the analysis finishes, a number of key metrics will be shown in the window as shown below.
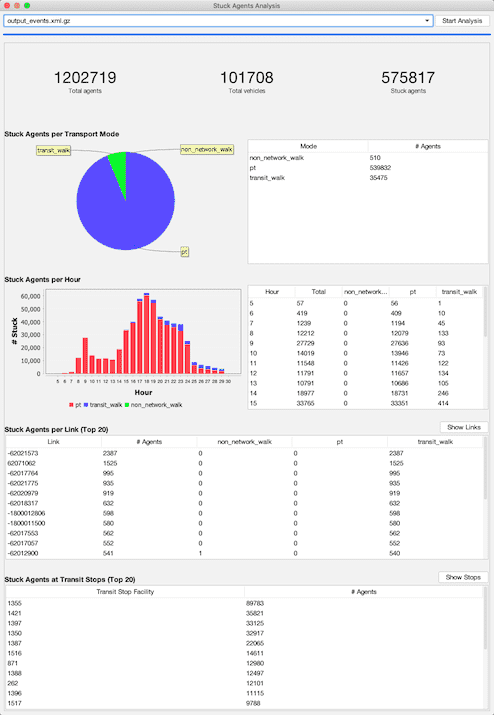
The pie chart shows what modes agents are using when they “disappear”. Often, there is one mode dominating the others, which can provide some hints as to where a potential problem might be:
- if
caris dominating, there might be either too much traffic in general (this would be visible by large traffic jams in the visualization), or there might be an issue with a few links (e.g. very low capacity, or very low or zero free speed). - if
walkis dominating, too many agents might try to walk very long distances. In this case, check the scoring parameters and replanning settings. - if
ptis dominating, agents might either get stuck inside transit vehicles somewhere along their route, or the agents might get stuck at transit stops waiting to board.
The “per Hour” analysis shows when agents were last seen. In a “normal” simulation, most agents should get stuck towards the end of the simulation time, indicating that most agents were just not able to finish one of their last trips in the day. If there is a significant number of stuck agents already in earlier hours, probably already during the morning or evening peak hours, then one should check further for potential problems.
The following two tables (Stuck agents per link, Stuck agents per transit stop) provide further details where agents get stuck. Especially in the case of transit passengers being stuck, this helps to identify if the problem is boarding a transit vehicle, or if the transit vehicles get stuck on their route.
With the buttons Show Links and Show Stops, the respective scenario elements with the highest numbers of stuck agents can be highlighted in the visualization area, providing insights if there is a spatial correlation to the problem or not. Also, this allows to have a look at one of the most affected links or stops individually. Especially in the case of transit stops, additional analyses can then be performed on the selected stop, e.g. to see the number of waiting agents at the stop, or the occupancy of vehicles departing at the stop.