Aggregation Analysis
The Aggregation Analysis plugins allows to work with arbitrary spatio-temporal data and to analyze such data in a large number of ways.
Table of contents
While one of MATSim’s strength—due to its agent-based nature—is its handling of disaggregated data, for the understanding and presentation of results, aggregated data has still some advantages. The Aggregator plugin helps in such situations as it allows to aggregate arbitrary geographical data into arbitrary regions or zones. Alternatively, it also supports aggregating data into origin-destination relations. Data sources for the aggregation can vary. The most flexible approach is using custom XY data. Alternatively, some layers in Via serve as a data source as well, e.g. activities or facilities.
Aggregating Point Data
To aggregate and analyze point data, create a new layer of type Aggregation Analysis. Click on the gear icon to open the layer’s settings dialog. In this dialog, the first section Aggregation Zones allows to define the zones being used for the aggregation. The second section Attributes allows to define one or more aggregations, which will then be available as attributes. The following sections Zones, Symbols and Labels control the visualization of the aggregation.
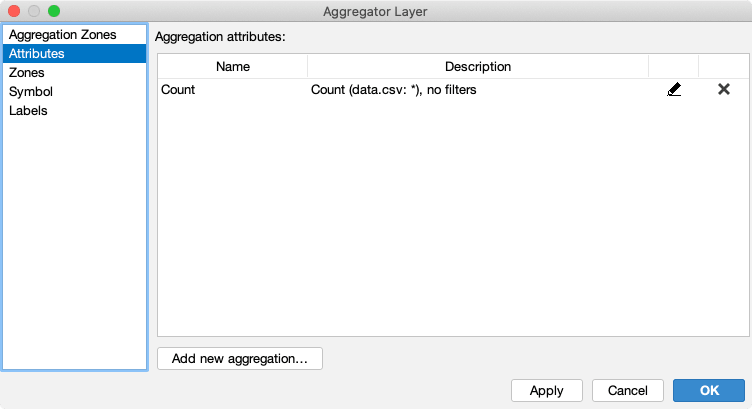
When defining an aggregation attribute, the following major settings need to be performed:
- Selection of the data source, e.g. an XY data set, activities, facilities or some other available data
- Optionally filtering the data
- Type of aggregation, e.g. count, minimum/maximum value, average, etc.
As aggregation zones, the following geographical spaces are available:
- Square grid
- Hexagonal grid
- Triangular grid
- Arbitrary shapes. Requires a loaded shape file.
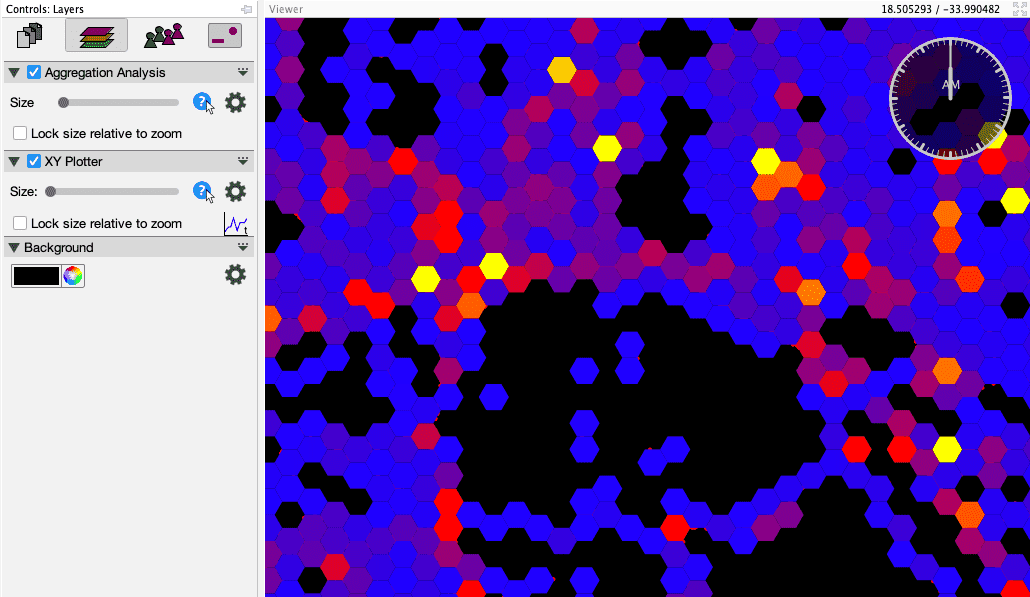
The following screenshot shows an example of some GPS traces being aggregated into hexagonal zones, resulting in a density map (heatmap) of the GPS observations.
Aggregating OD Data
Sometimes, one is interested in aggregated movements, e.g. the number of trips from one region into another one. Create a new layer of type OD Aggregation Analysis to perform such aggregations. The configuration of the aggregation is very similar to the one of the point data aggregation, except that you might have to specify a second pair of x/y coordinates for the aggregation to work.
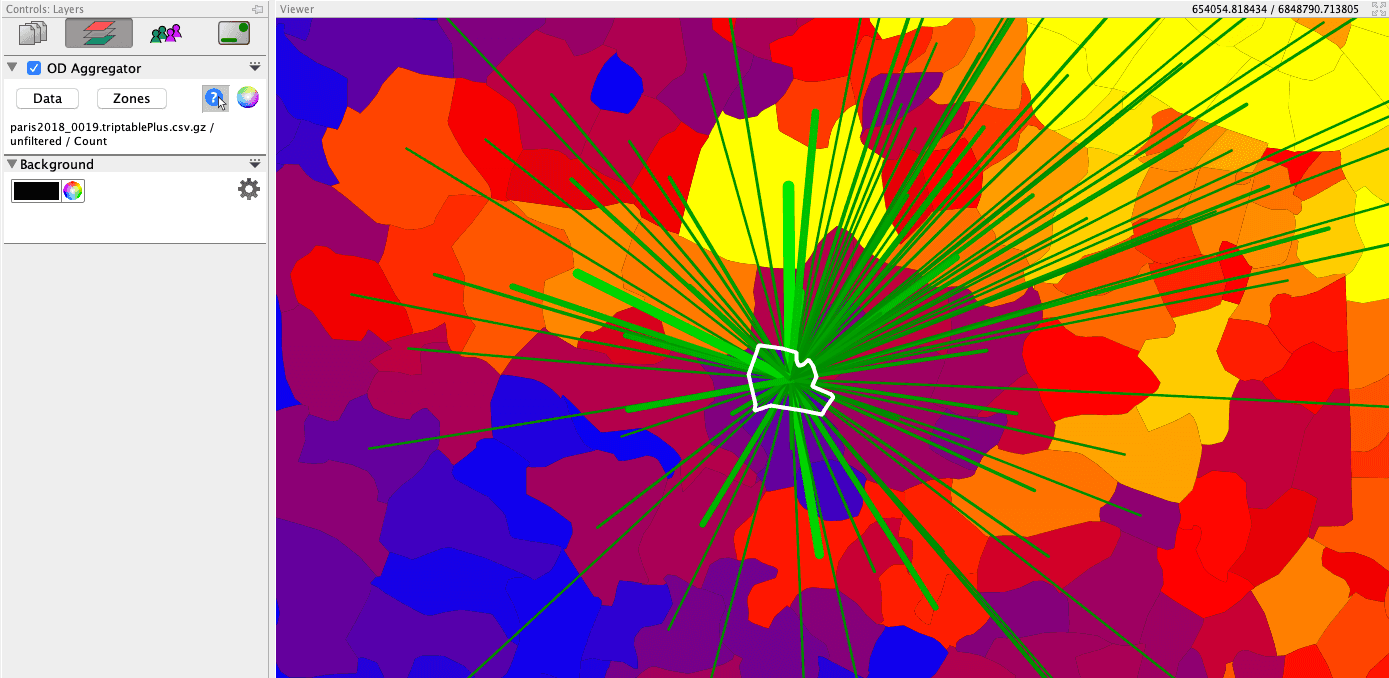
When visualizing the results, this layer differentiates between incoming and outgoing data per zone. In the case of trips, this relates to trips ending or trips starting in a specific zone. When quering a zone with the corresponding query zone, the incoming/outgoing values always relate to the selected zone. In the example shown, trips are aggregated, leading from one zone to another zone. Only incoming relations are visualized, “incoming” relative to the selected zone (the one with the white border).